AIOps vs Observability vs Monitoring – What Is The Difference? Are You Using The Right One For Your Enterprise?
This article was originally published in Forbes on Feb 2, 2021
In the last few months, I have been analyzing and writing a research report for GigaOm in this space, which is due to be released soon. I looked at about 30+ vendors in this space as part of that process and did a deep dive with 20 of them. In that process, after talking with these vendors, a bunch of their customers, and a few CXO executives, I found a lot of confusion.
Some of the confusion is vendor-created, and some exist because customers don’t understand what the different terms really mean:
- Some of the vendors seem to be purposely using the terms interchangeably, to confuse the buyers.
- Users are confused with the capabilities of each offering/platform and the true differentiators, as they overlap in many situations.
Mostly, customers are buying Observability solutions because vendors tell them these are the most important next step towards the “Cloud-native” era. This may be true, at least in part, but before you make that plunge, you need to understand what observability means, and how it can help with your situation.
Observability and AIOps start with a very basic premise: learn what happens within your systems and avoid extended outages. Building resilient systems that are available with high uptime is the end goal for any business: solutions all work towards achieving the unicorn status of Zero Mean Time to Resolution (MTTR).
Over recent years, this has become harder to achieve. During the monolith architecture days, both dev teams and Ops teams would get full visibility into an app as it is not very distributed. It was relatively easy to isolate a problem, identify the components that are not working efficiently, and resolve the issues. In those days, monitoring would provide the status of the apps (the metrics portion of it), and logging would add details to figure out what exactly is wrong with the application.
In cloud-native architectures, however, application components have become smaller, short-lived, and ephemeral. It is hard to use old-style monitoring (aka APM) or just logging to figure out where the problem is, which is why Observability has emerged as an important category, even if elements of it are not new.

Observability consists of three telemetry components: metrics, logs, and traces.
- What is happening? Metrics will allow you to look at the status of the application and its components. Telemetry information, such as application RED (Google SRE fame), which measures rate, errors, and duration (response time/latency), will let you know if your application is functioning properly. At the very least, you should be monitoring the 4 golden signals stated in the Google SRE: latency, traffic, errors, and saturation.
- Where is it happening? When you build a distributed application, your application will be spread on containers across multiple Kubernetes clusters, across multiple cloud locations, On-Prem, etc. This is where Traces can help. Tracing (or distributed tracing) allows you to trace your transaction from start to finish. By tracing the path, you should be able to figure out easily where the application is slowing or what components are causing the issue.
- Why is it happening? This is where the Logs can help. Both machine logs (created by systems) and human logs (created by developers) can help identify if there is an issue. Because you have narrowed it down to a specific component in step #2, it is easy to deep dive and find out what went wrong.
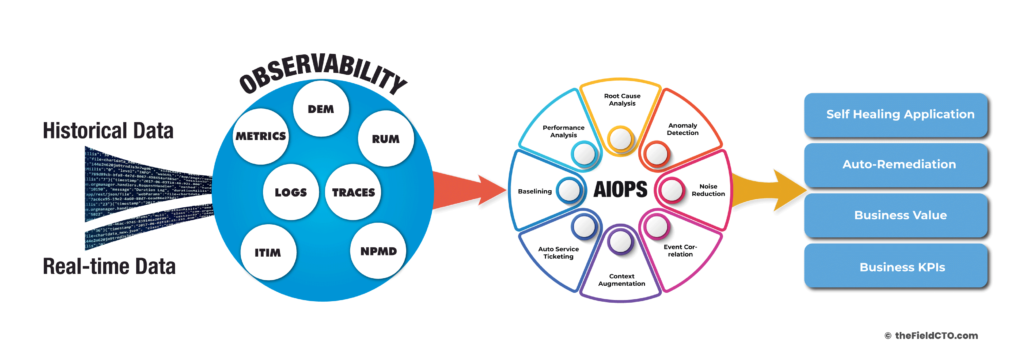
So, how does Observability relate to Monitoring and AIOps? Observability is about complete visibility across your systems and tying business metrics with technical data, Monitoring is about understanding if things are working properly, and AIOps is about getting meaning from that visibility. While it can exist separately, AIOps is technically part of observability. [Note however that there is a school of thought that IT automation and self-healing apps are part of AIOps, which is generally out of scope for Observability.] The scope of Observability, to a large extent, is about helping you identify the problem as soon as, and sometimes even before, an incident happens. In other words, if you haven’t achieved full Observability status, then you will be wasting a lot of money and effort in building AIOps systems.
While AIOps and Observability can work without the other, they complete each other for a holistic solution. AIOps requires observability to get complete visibility into operations data. Observability depends on AI to provide deep insights as the amount of data collected is huge when you do cloud-native, distributed microservice applications.
Assuming you have total observability information (MELT) that you can feed to an AIOps platform, the latter can correlate the events and identify the problem using AI/ML without the need for deeper manual intervention or extended war rooms. A properly implemented AIOps system detects anomalies, suppresses incident noise, alerts only the real incident that needs attention, identifies the location and cause of the incident, and suggests what can be done to fix it.
So, in conclusion, observability is the response to the increasing complexity of distributed cloud-native systems. By focusing on observability, you are grabbing the bull by the horns, and you can then bring in Monitoring and AIOps to help you towards your goals – monitoring to feed, and AIOps to level up.
Also, check out my earlier Forbes articles and my other materials on this topic:
- AIOps is more about data than AI itself – Forbes – Jul 2020
- How To Rise Above The ITOps Chaos Using AI – Forbes – Feb 2020
- My recent podcast on Observability and Open telemetry – Logz.io – Dec 2020
If it is all still too confusing, please reach out to me. I would be more than happy to help in any way I can with your “fully observable, AIOps infused cloud-native” journey!


